Explorer
Explorer gives you a landscape view of data objects and locations so you can spot where sensitive information concentrates. Use it to move from a high level posture view into the labels, locations, and files that need attention.
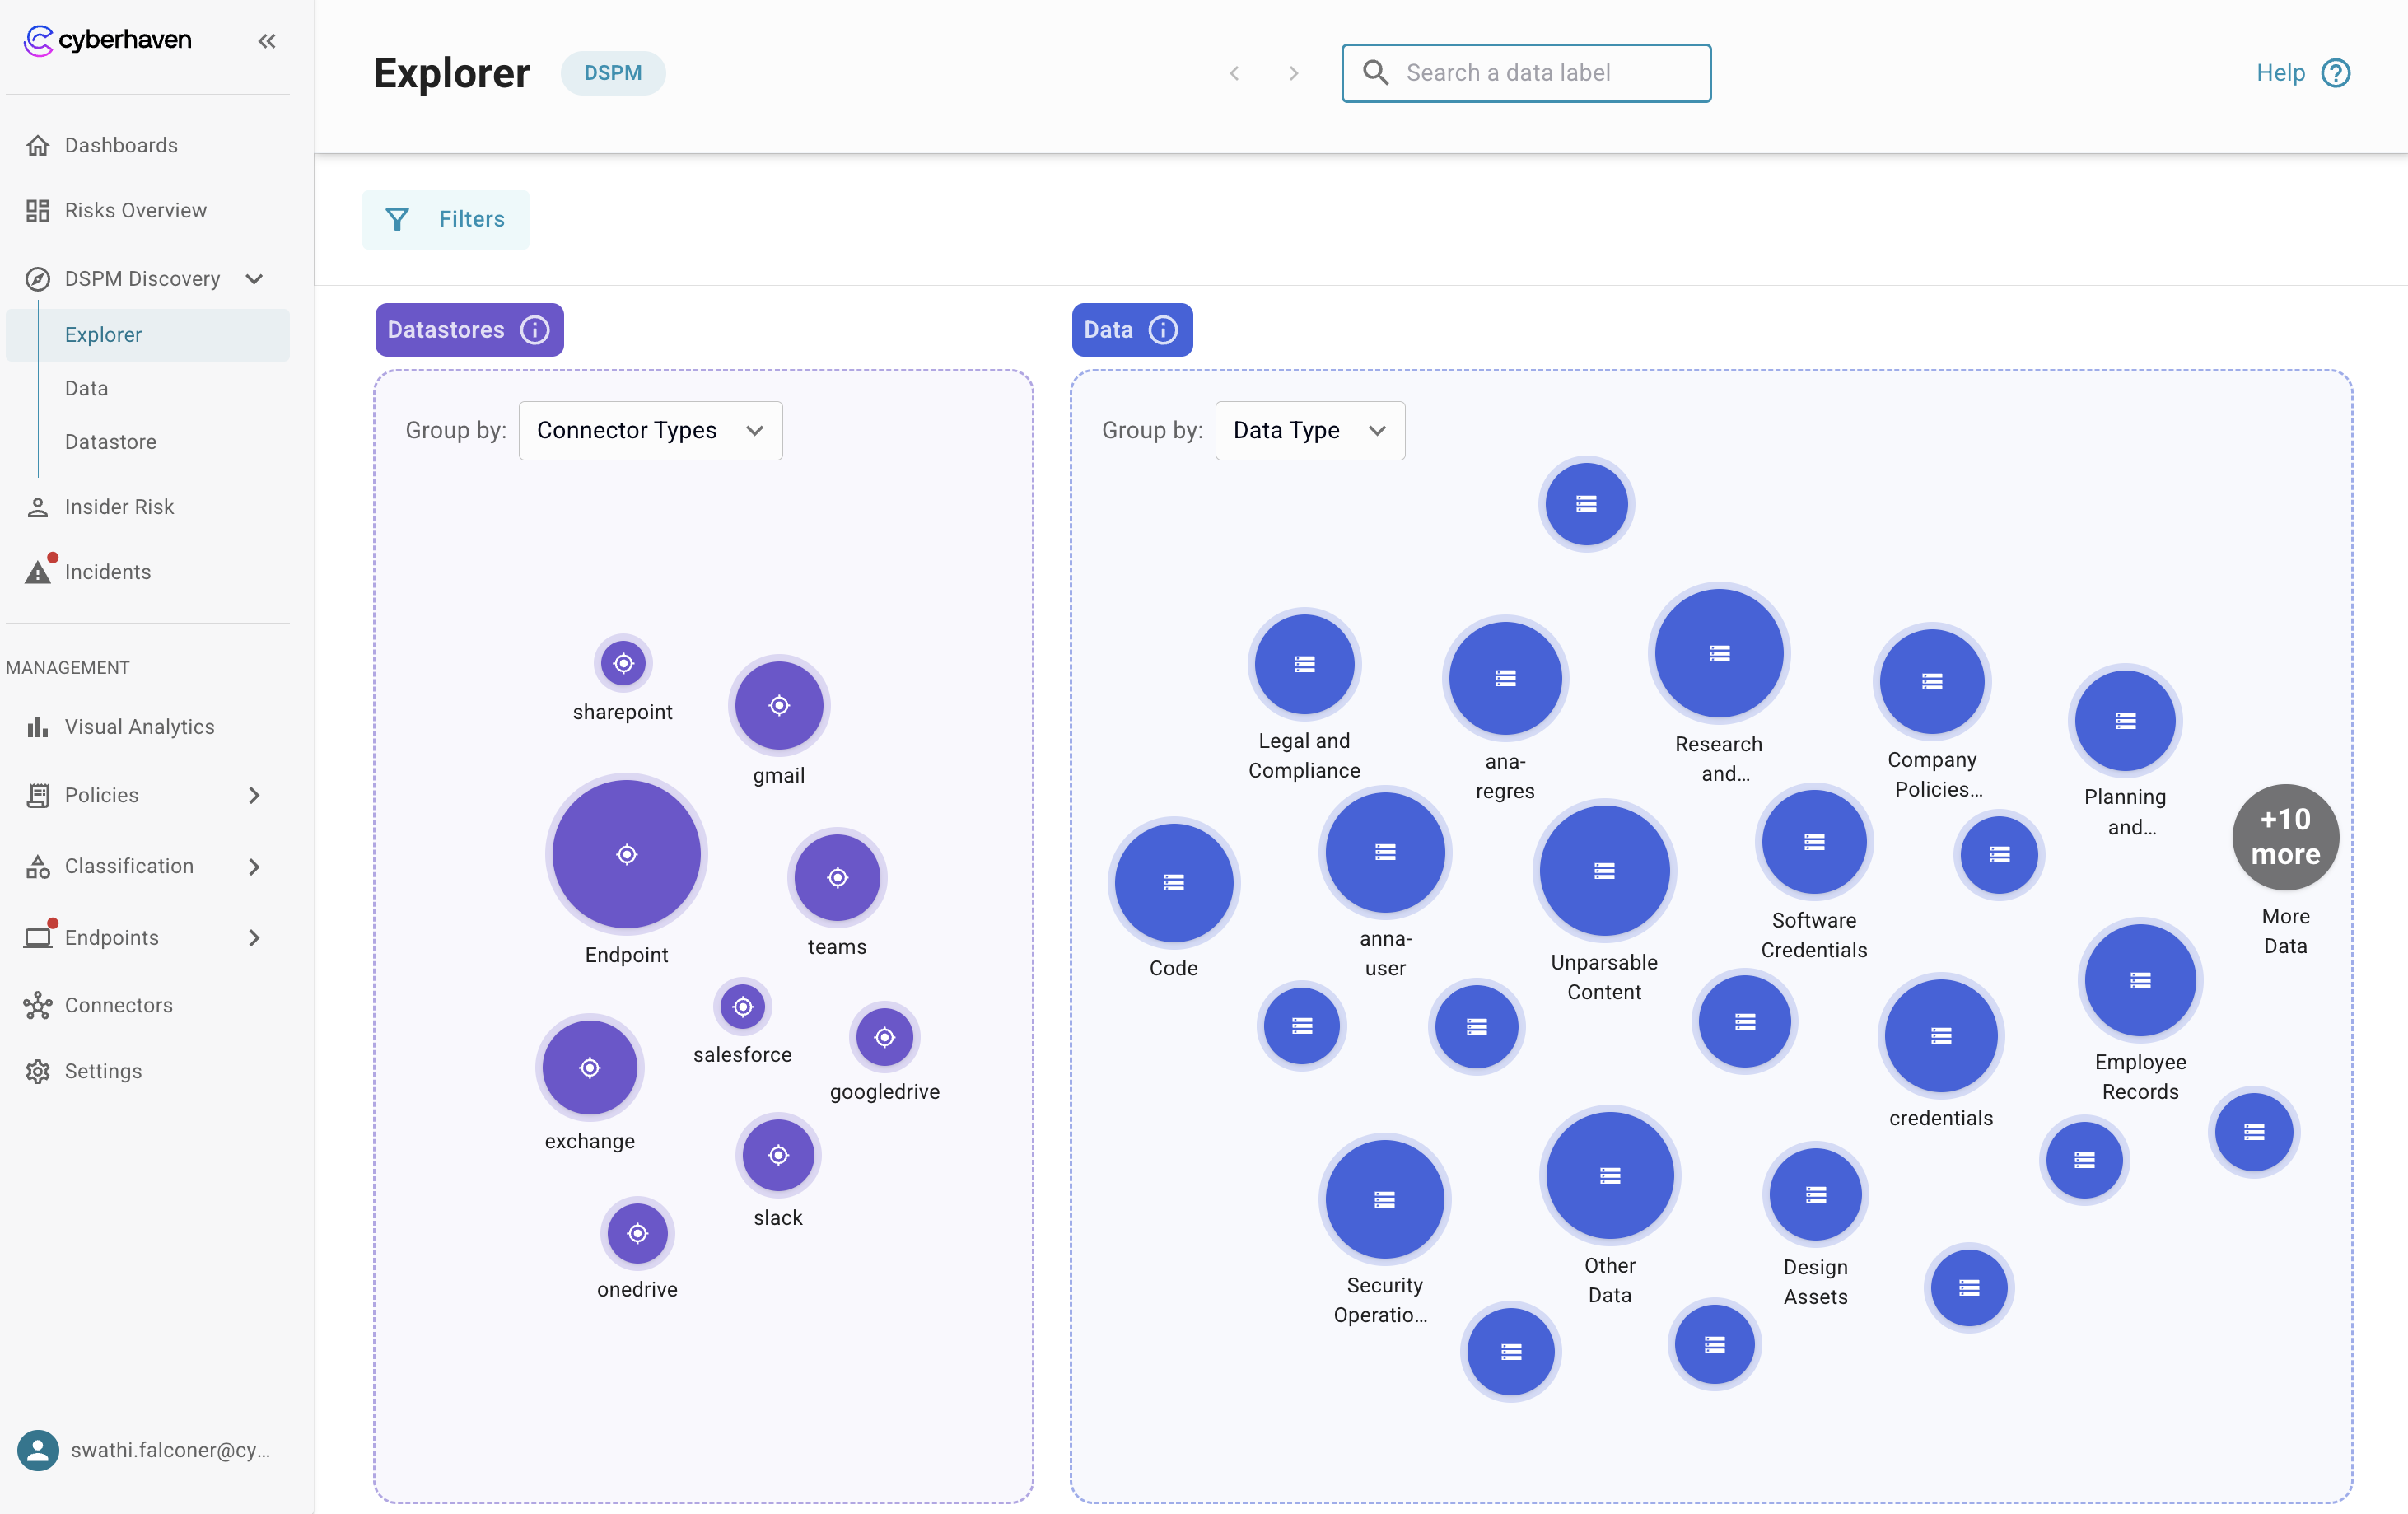
View the data landscape
- The data is presented in two panels:
- The left panel shows datastores grouped by connector type.
- The right panel shows data objects grouped by Data Type by default.
- Bubble size on the left is the number of datastores and on the right is the number of data objects. Larger bubbles mean more items.
- Hover or select a bubble to see the label and count before you drill down.
- Explorer shows managed datastores. It does not show data in motion.
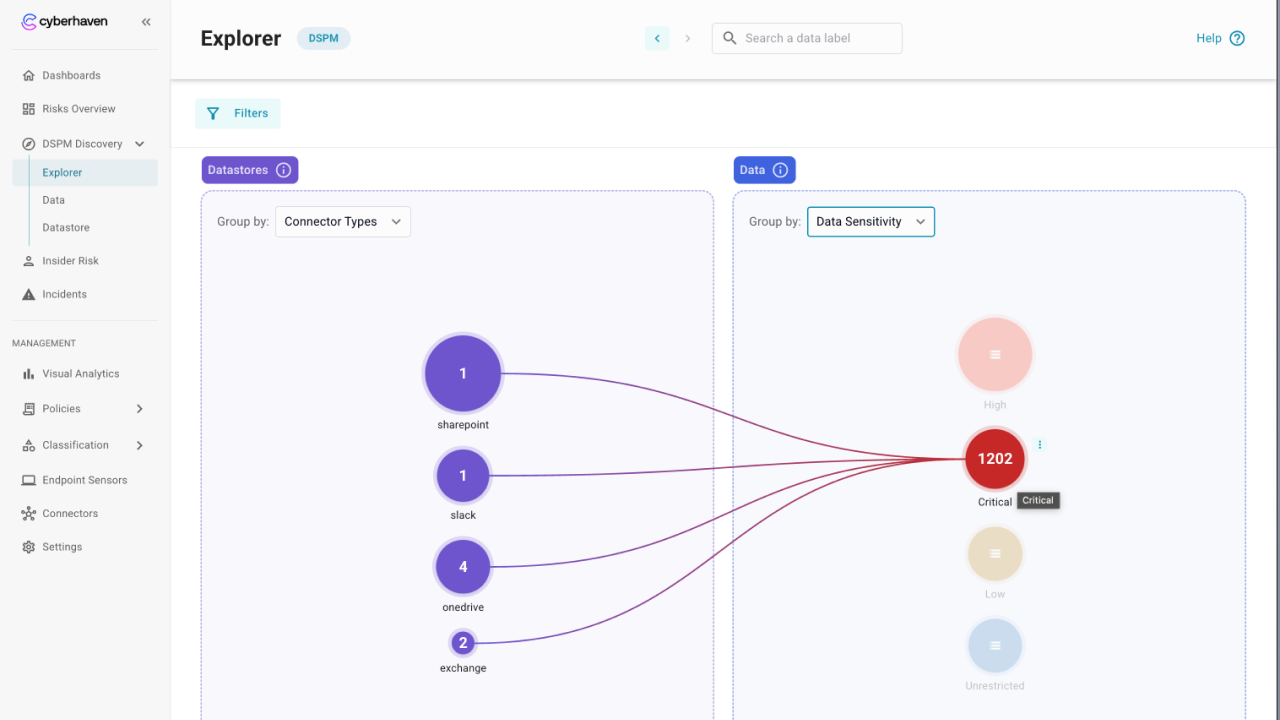
Change the grouping to find risk
- Group data objects by any available label set such as Datasets, Data Type, Data Provenance, Data Pattern, or Data Sensitivity to surface high risk categories.
- Group locations by connector type in EA. Support for grouping by additional location label sets to enable deeper views will be introduced in a future release.
- Use grouping changes to compare how objects spread across repositories and labels.
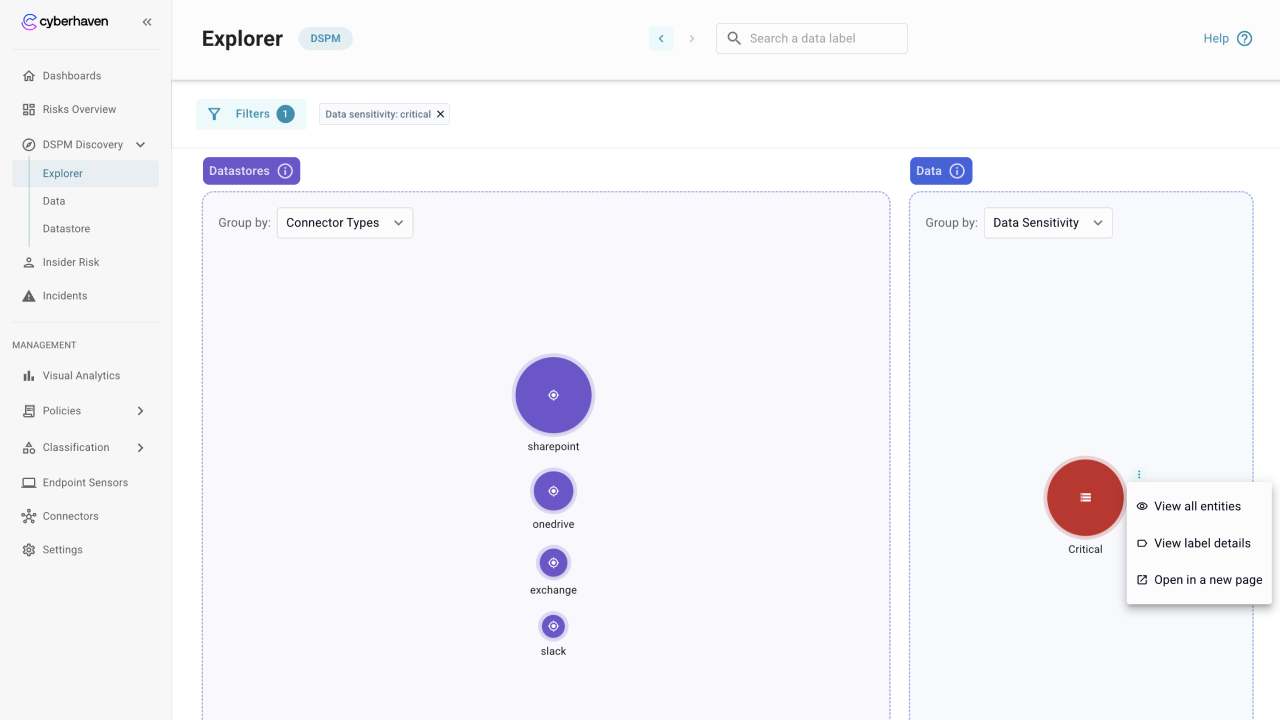
Filter to focus on sensitive data
- Apply filters to hide noise and keep only the labels or locations you need.
- Combine grouping and filters to isolate a slice, such as critical sensitivity objects in SharePoint or OneDrive.
- When you click a bubble, Explorer applies the filter automatically so you can continue the investigation.
Drill into labels and objects
- Click on a bubble to see matching datastores or data objects.
- Use the actions menu next to a bubble to view all entities, open label details, or open a new page with the full list of objects and labels.
- Navigate from Explorer into the Data page to view the full object list for the selected item.
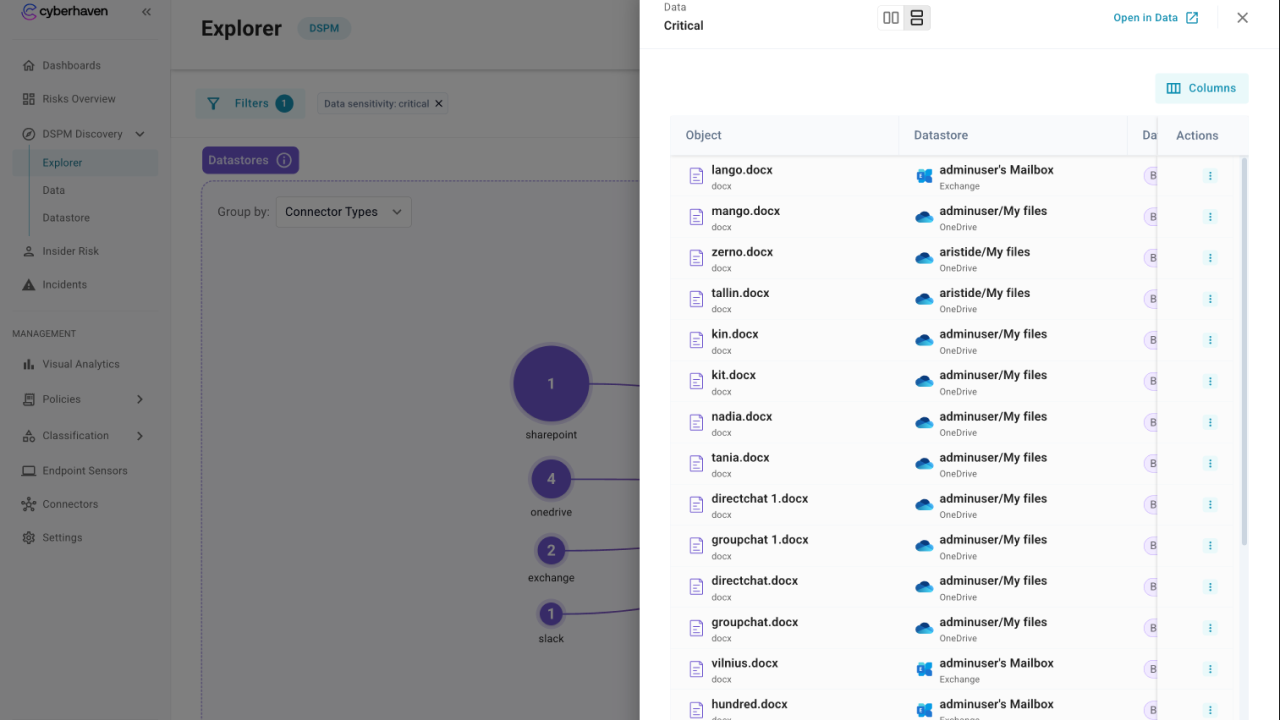
- Open label details to see definitions and understand why items match.
How admins use Explorer
- Start posture reviews here to see which repositories hold the largest sensitive object counts.
- Pivot between label sets to identify patterns, such as internal provenance combined with high sensitivity.
- Use the applied filters from Explorer when moving into Data so the same context stays in view.