Detect
This dashboard provides an overview of your current blocking policies. It
highlights the percentage of events blocked by policies versus those that were not blocked. Additionally, it identifies the least frequent destinations to which your data was sent.
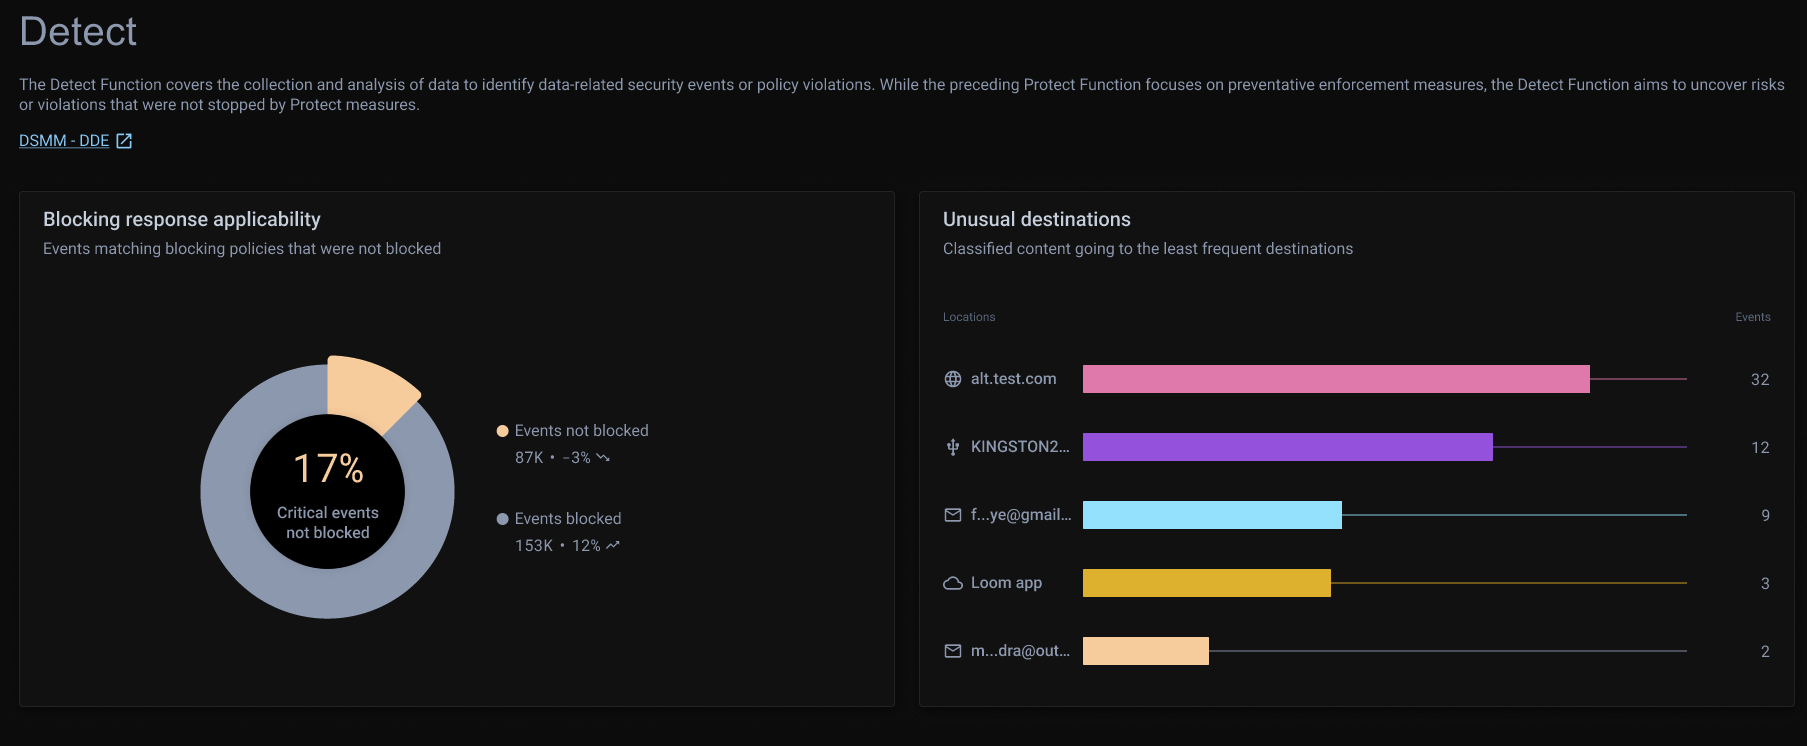
Blocking response applicability
This panel displays a donut chart comparing the percentage of events blocked versus those not blocked by existing policies. This information assists in prioritizing unblocked events and assessing whether any of the associated data should have been blocked.
Clicking on chart segments filters the incident details on the Incidents page for a more focused view.
Unusual destinations
This panel shows a horizontal bar chart displaying the least frequent destinations where your data was sent during the selected period. It helps identify anomalies in data destinations, enabling you to evaluate whether data should be sent to specific locations.
Clicking on a bar navigates to the Risks Overview page with a filtered view of policies matching the location, allowing you to easily update datasets and define appropriate policy responses.